

Instant Project Dashboards for AequilibraE
Over the last two months, I have been interning with Outer Loop on the integration of web-based visualisation capabilities into the AequilibraE ecosystem.


4 min read
Over the last two months, I have been interning with Outer Loop on the integration of web-based visualisation capabilities into the AequilibraE ecosystem. This started with an exploration of the available packages and frameworks, which led us to choose the SimWrapper project due to its technical and philosophical fit with the AequilibraE project. More recently, I have been building on the new features that Tom Stephen contributed to the SimWrapper project to automate dashboard generation for AequilibraE projects.
The key aim of this work was to reduce the friction required to generate shareable SimWrapper dashboards for an AequilibraE project (network overview, link-type breakdown, etc.) and to explore results from scenarios the modeler has run. By programmatically using the AequilibraE project structure and results, the workflow becomes consistent, scalable, and fast.
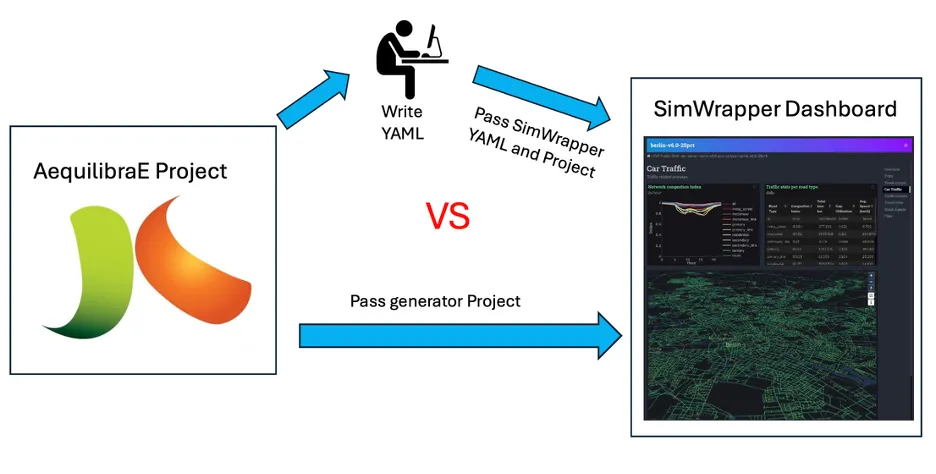
Key steps included detecting the structure of the network, identifying available assignment scenarios, and styling maps and graphs to accurately convey key components of the project and results. As this tooling is being built into the core AequilibraE codebase, it needs to be flexible enough to work across a wide range of typical AequilibraE models.
Output files include the SimWrapper “YAML” configuration file, Vega-Lite graph specifications, and supporting CSV files, derived from the project directly. This avoids any hardcoded assumptions.
In the following I will give some examples of dashboards generated by the tool.
Network Overview
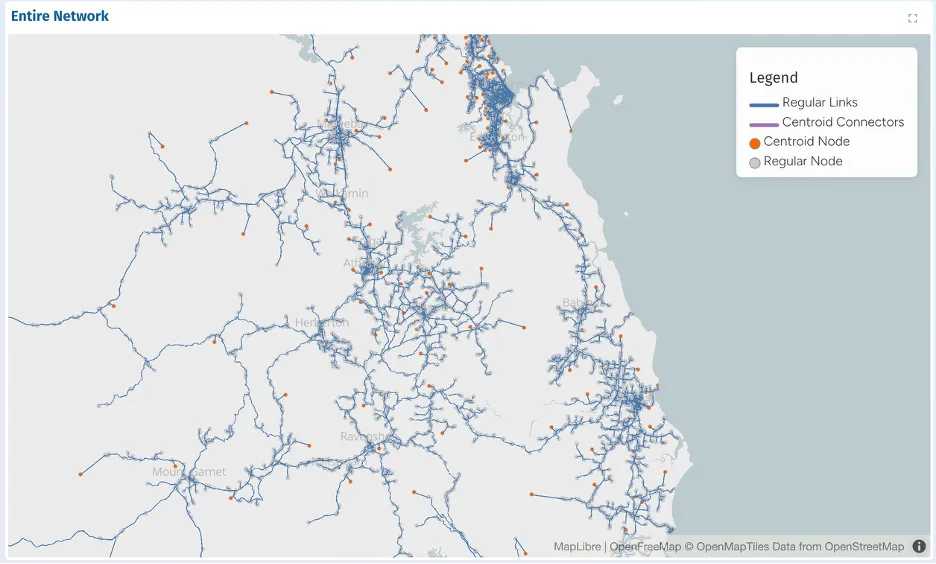
The Network Overview section provides a high-level visual summary of the transport network within an AequilibraE project. It displays all links and nodes, distinguishing between regular links, centroid connectors, and centroids versus network nodes. Map centre and zoom are computed automatically from the network geometry, so dashboards load at an appropriate scale regardless of geographic model extents. Legends are similarly generated to clearly communicate network components. These features allow users to quickly understand the model structure before exploring results for specific scenarios.
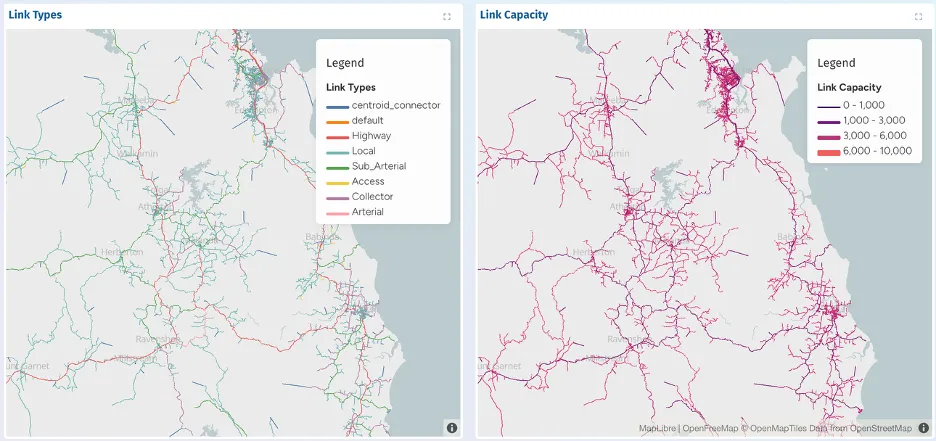
Scenario Results
When running modelling projects using AequilibraE, modelers will generate multiple scenarios with varying inputs and assumptions. The tool I developed will explore the project to find each scenario that has been run, and produces for each and can produce for each:
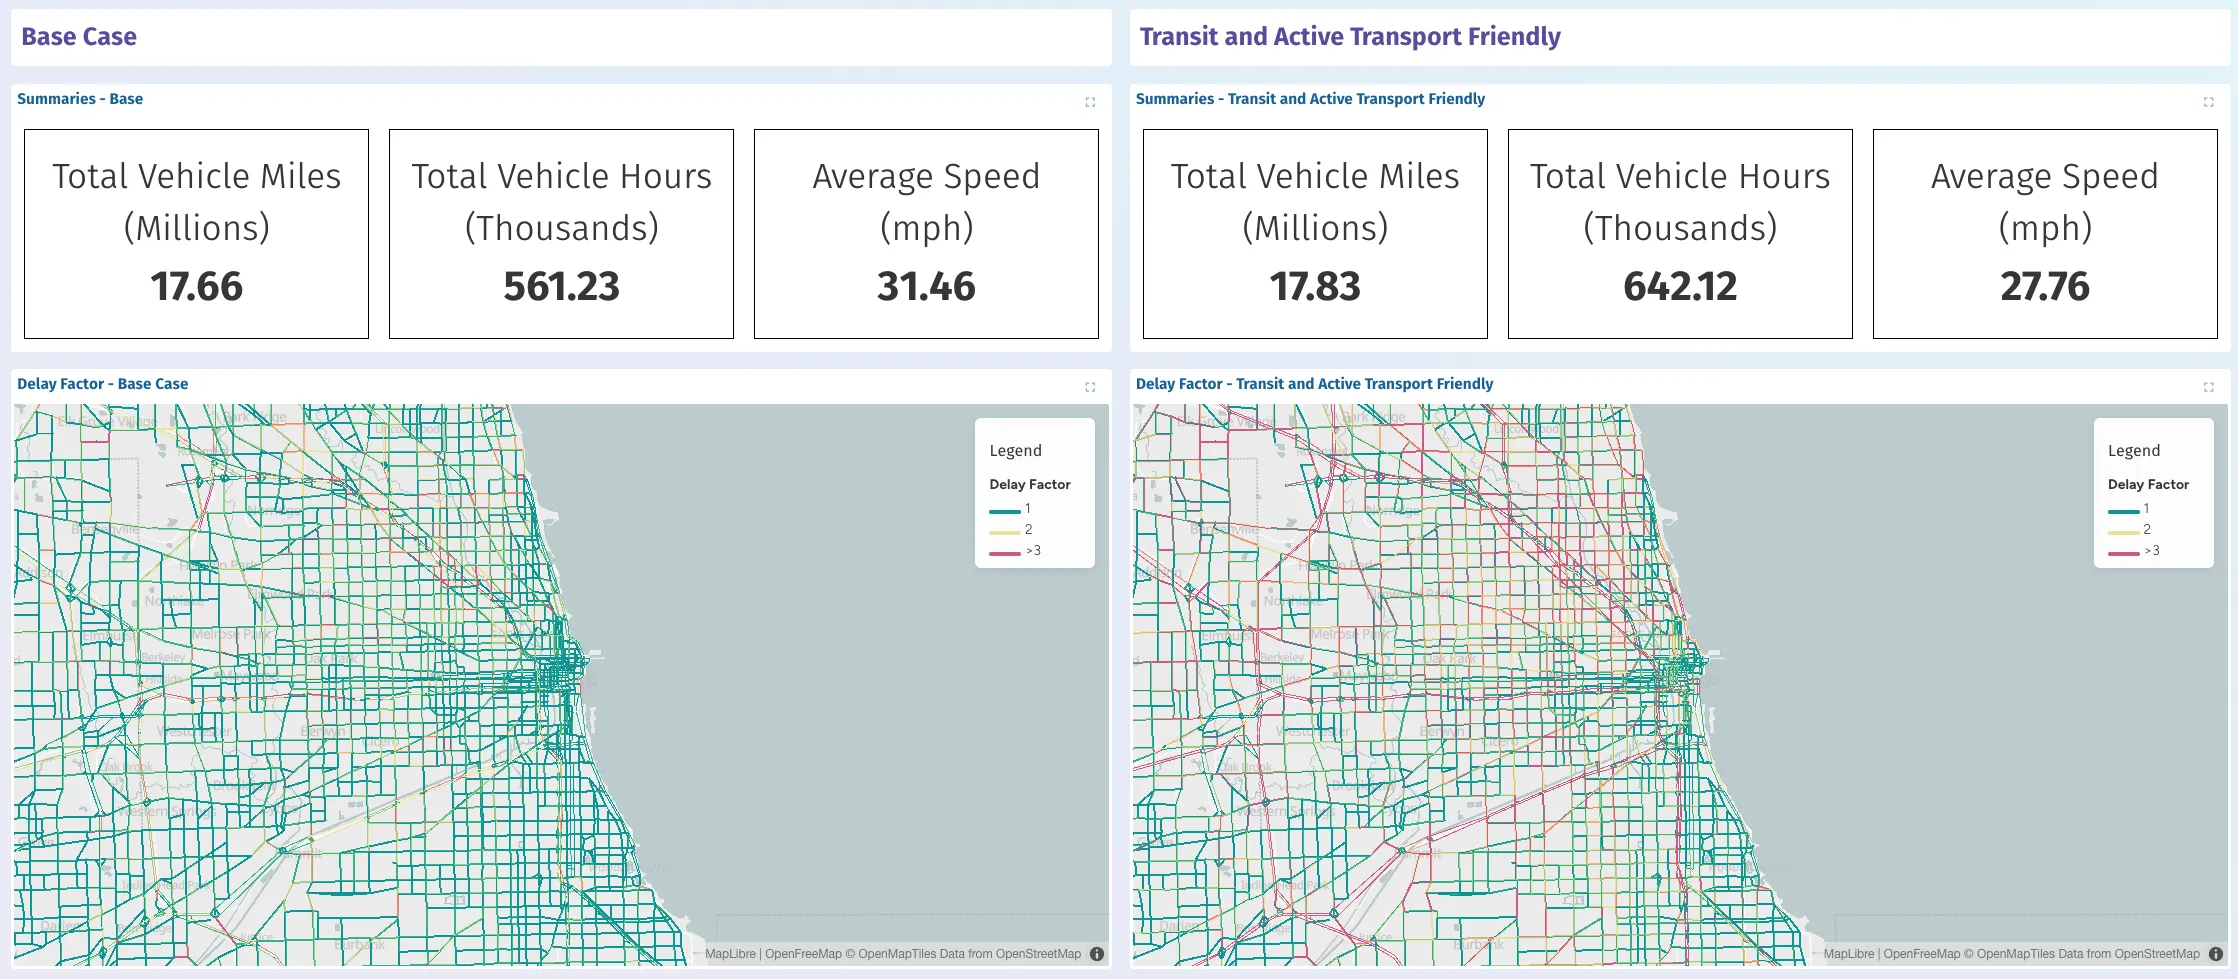
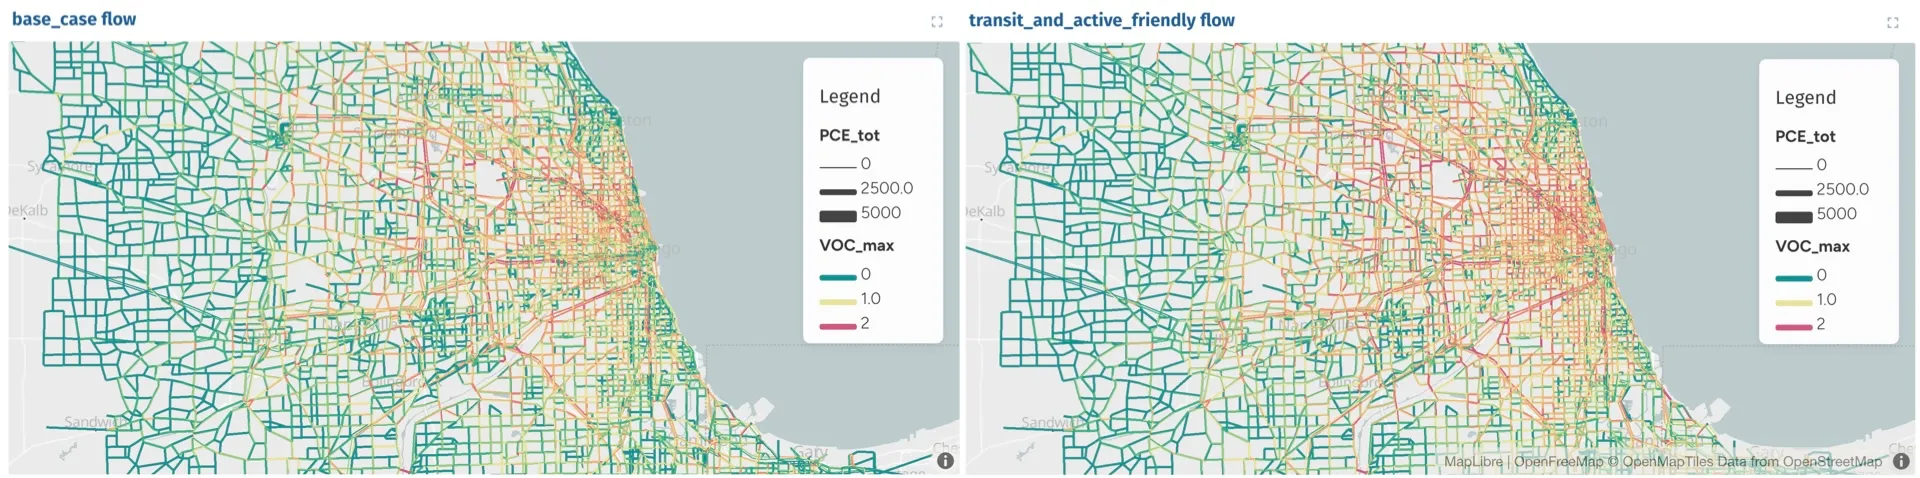
- Congestion levels - To visualize congestion, the tool generates multidimensional capacity and flow maps. In these, link colour represents a performance metric, like volume to capacity ratios, and line width is scaled based on flow measures, like passenger car equivalents. This allows users to quickly assess congestion levels and demand intensity across the network.
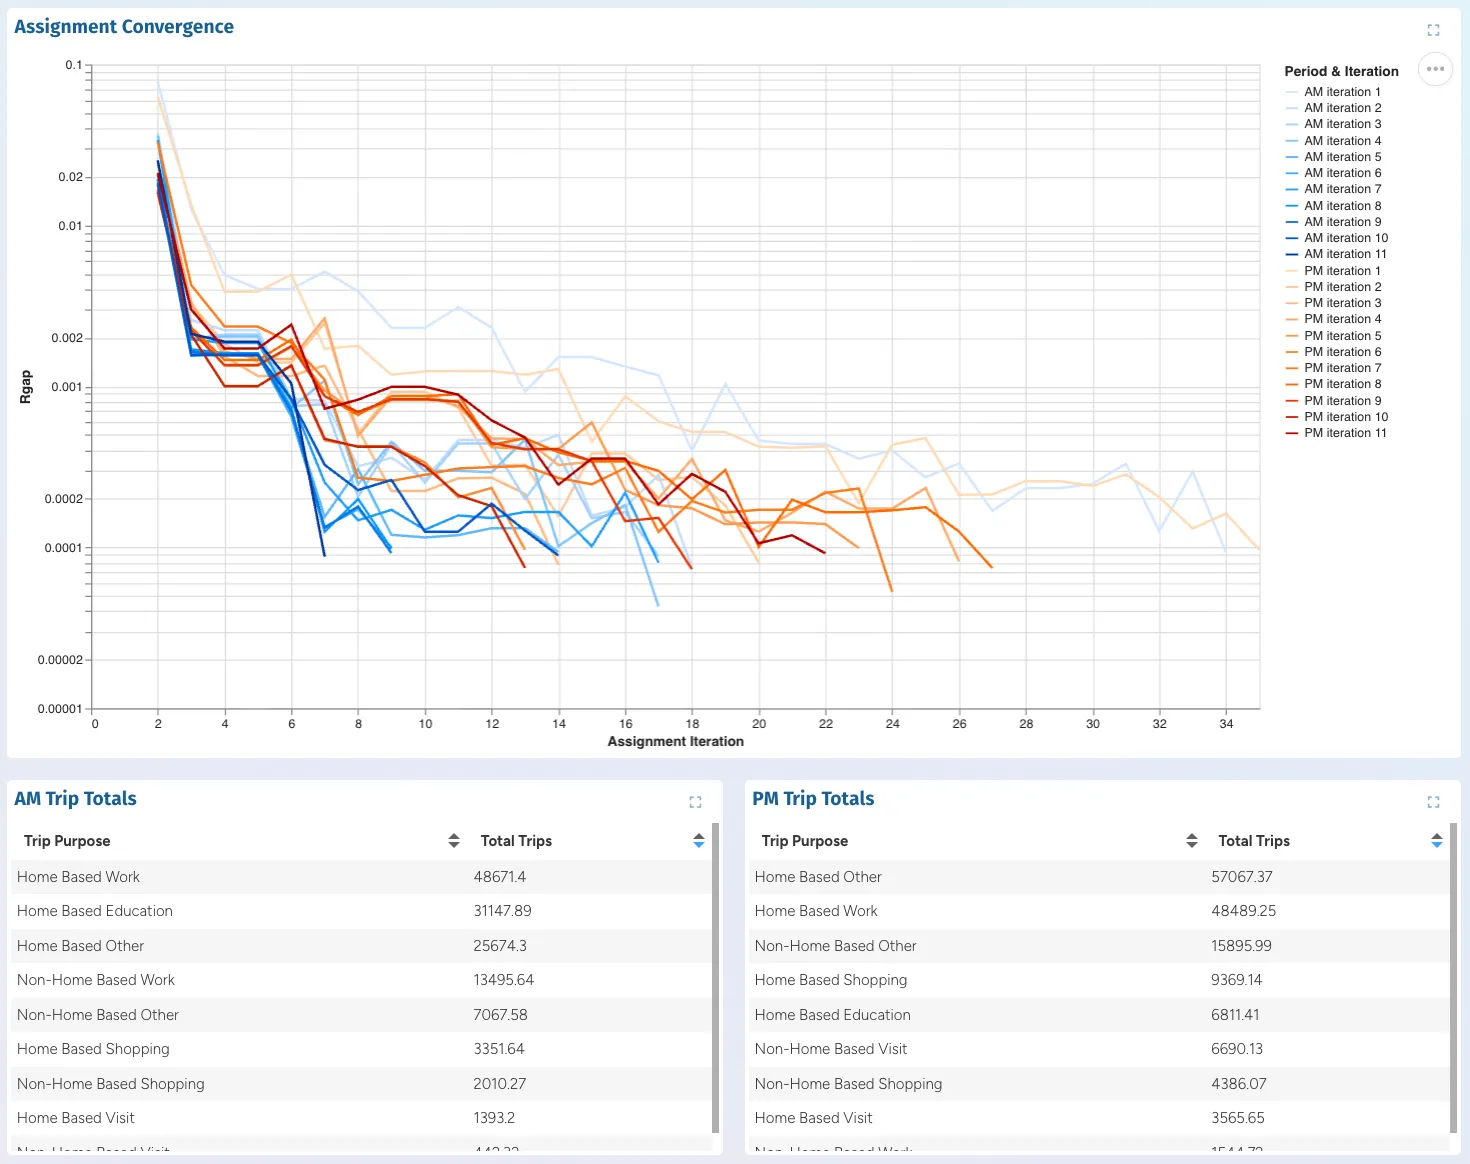
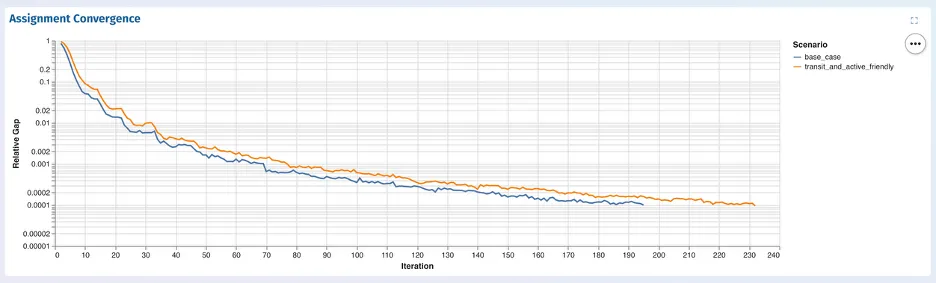
- Assignment convergence – The generator extracts convergence data from the AequilibraE procedure report within the project’s results database. Iteration counts and relative gap values are parsed and exported to a unified CSV file, which is then visualized as a Vega-Lite line chart in the dashboard. This allows users to quickly evaluate model stability and assignment performance without manually extracting or processing convergence data.
During testing across different AequilibraE projects, I encountered models with a large number of assignment scenarios. To maintain dashboard performance and readability, the generator applies a predefined threshold to limit the number of panels displayed when scenarios exceed this value, and adds a note to explain this to the user. Alternatively, the user can maintain control by specifying only the subset of scenarios they are interested in visualizing.
Conclusion
The outcome of the project is a new feature for AequilibraE: The ability to generate a complete SimWrapper dashboard directly from an AequilibraE project, without requiring manual YAML configuration. This generator was tested on several real-world models.
Throughout this project, I have developed a deeper understanding SimWrapper’s styling and rendering behaviour and gained insight into the significant variability in structure that can exist between transport models. Network structures, naming conventions, scenario definitions, and performance metrics can vary significantly between projects. Designing a system that could robustly adapt to this variability without manual intervention was one of the key learning experiences of the internship.
In future iterations of this tool, I’d like to see improvements to provide more comprehensive input validation, expanded support for additional performance metrics, and user configurable styling templates.
By automating the dashboard creation, this new feature improves reproducibility, reduces setup time, and dramatically lowers the barrier to exploring and communicating transport modelling results. Ultimately, this makes AequilibraE more accessible and intuitive for modellers seeking rapid insights and for non-technical users who need a clear and interactive view of model outcomes.