
Is your software choice responsible for your high cloud costs?
Here at Outer Loop, we are often working on developing new models to answer specific transport-related questions, and we …


According to BITRE the total Australian freight task will grow by 25% between 2018 and 2040, reaching a total of 962.5 billion tkm in the end of that interval, with over 337 billion of which expected to be road freight. According to the Australia Post, however, the year-on-year growth of online shopping is much bigger, having grown by over 11% for the 12 months preceding Jan 31/2022, indicating a disproportionate growth of urban freight when compared to the expected total growth in the freight task.
(Maybe responding to this trend) A few states, such as Queensland and New South Wales, have been working on their state-wide freight models for a few years now. As far as we can tell, however, most effort so far has been put on modelling road freight at a somewhat spatially aggregate level, while less effort has been dedicated to the modelling of the whole of the freight task (including all modes of transport).
According to McHugh, Camargo & Van Vuren (ATRF, 2021) , “The absence of robust freight models can be partly attributed, however, to irregular and inconsistent collection of data and hence poor availability of useful statistics on freight movements across the country. In some cases where good data is collected, such as by shipping agencies or logistic companies, it is not able to be accessed in its entirety due to its proprietary or confidential nature.”
Maybe for this reason, urban freight modelling is still quite incipient in Australia, with most planning models, public and private, being limited to simple truck models that were originally built to provide some background flow to modelling the urban congestion caused mostly by private vehicles, and we should note that this was sufficient and perfectly adequate in the past.
Looking at the USA as the major country with the most solid tradition of urban freight modelling and forecasting, it becomes clear that its freight modelling practice relies heavily on a few key data sources (ranging from free to extremely expensive) that are available at national level.
Among the free datasets available in the USA, the most relevant for sure is the Freight Analysis Framework (FAF, currently in its 5th version), which is a national freight model developed at a fairly disaggregate level and that makes its road network and demand matrices available for the entire country at a more aggregate level (This is an oversimplification of FAF. For a complete reference visit its website). In turn, FAF is made possible by the existence of the Commodity Flow Survey, conducted by the US Census every 5 years, but we will keep the argument focused on FAF rather than on CFS.
One of the key advantages of FAF is that it provides control totals for several commodity groups and forecasting horizons, contributing to consistency in modelling outputs across state lines while offering a frame of reference to each state’s own forecast (FAF provides forecasts on 5 years intervals up to 2050).
In Australia, the closest dataset we have to FAF is the 2014 ABS Road Freight Survey (RFS), which was a one-time survey and did not cover the entire freight task by ignoring modes of transport other than trucks.
Other datasets that are readily available in the US are Transearch and the ATRI truck GPS data. The first one provides a complete overview of the freight task at a high geographic resolution, although it is itself the product of proprietary models and is exceedingly expensive. The second, however, consists of raw GPS traces for trucks throughout the USA, and although traditionally biased towards larger trucks, it has been historically inexpensive and extremely valuable for model development.
On the supply side, the US Census also provides the national rail network in a single consistent format, as well as a road network in different levels of detail, both of which are not available in Australia.
After a few months of internal research developing a National Road Model connected at SA1 level, we have recently completed the development of a national rail network and coastal shipment network models, which were both integrated into a national multi-modal transportation network.
Building the network, which is still being augmented with rail and intermodal terminals, allowed us to see how fragmented and inconsistent the data available for different states in Australia is and how difficult it will be to build a national freight model.
Despite the network still being under development, we were curious to see how well the intermodal pathfinding was behaving and what type of multi-modal analysis we could do. There was one type of question that immediately presented itself when we started discussing the types of analyses we could do, and that was with regards to the multi-modality potential that is currently wasted by transporting cargo mostly by truck. In other words, how much of the existing road freight could be transferred to rail?
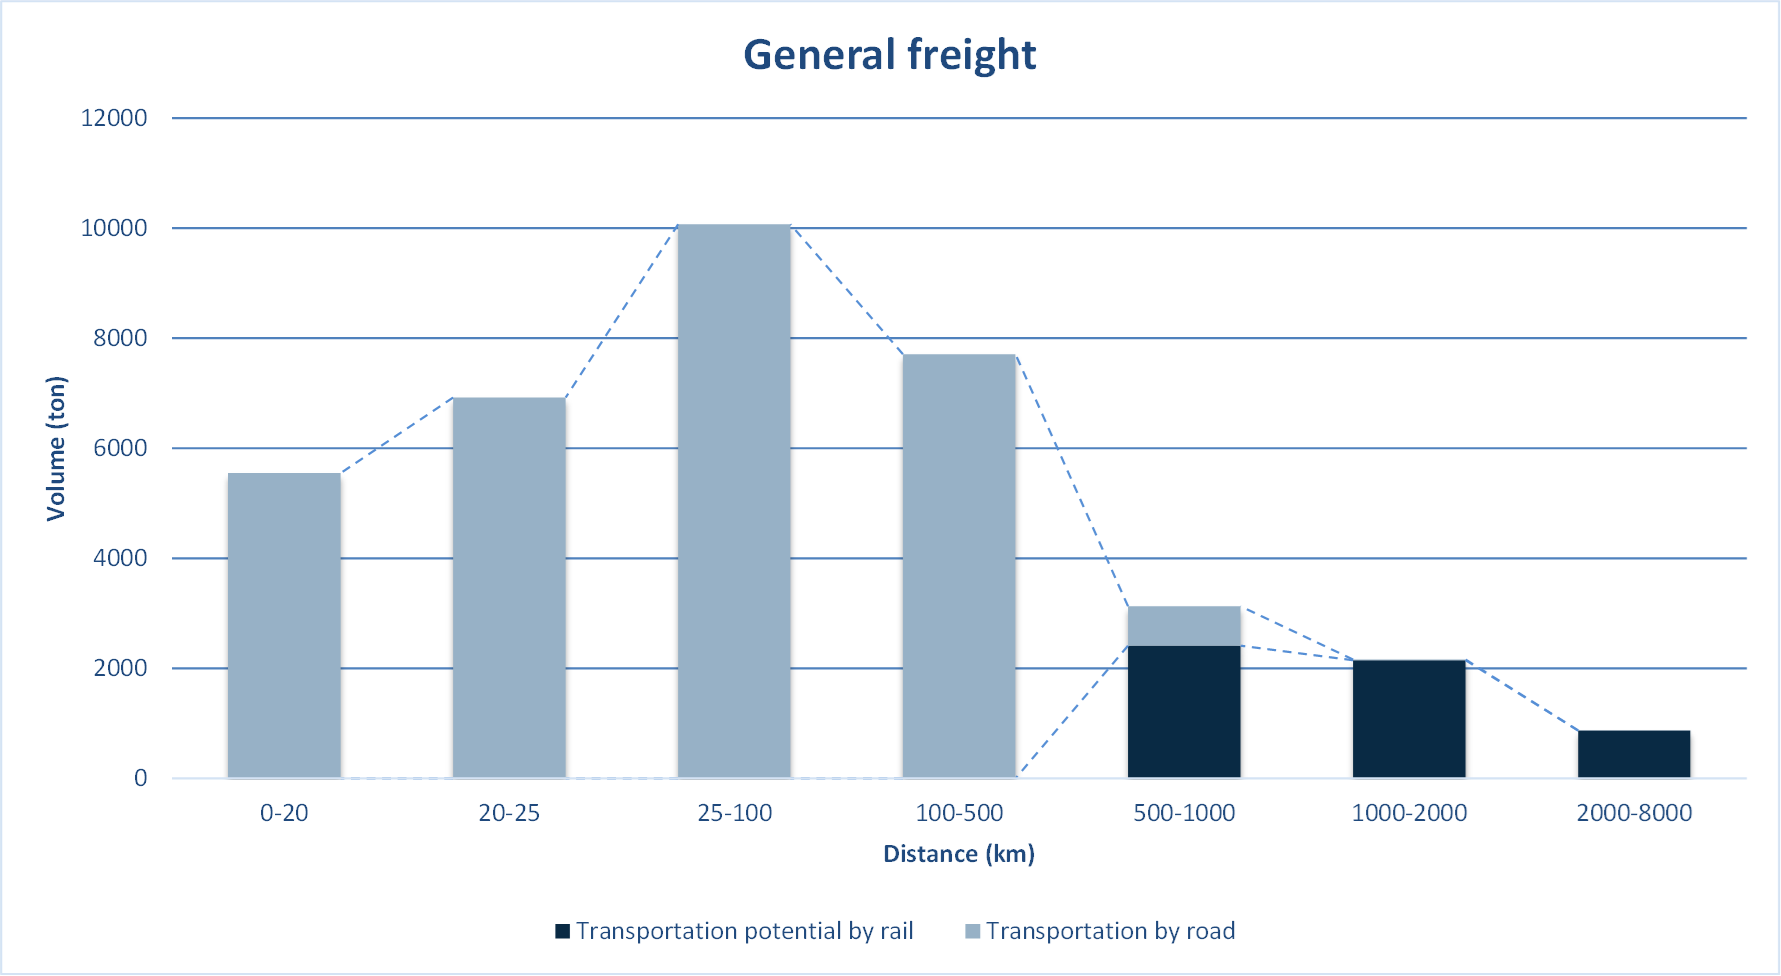
To perform this analysis, we used the 2014 ABS Road Freight Survey for Queensland only, which is the most comprehensive view of road freight available (even if already a bit old) and focused on products that could, at least in theory, be transported by rail.
We also focused on movements of at least 500km and that could be substituted by a multi-modal route with at least 80% of it being on rail. Although the total long-distance flows by road were not substantial in the RFS data set, the percentage of those that could reasonably be transferred to rail was very high. The product with the highest potential, General Freight, could bring a reduction of 6.6 Mton.km reduction in road transportation, with an increase of 8.8 Mton.km of rail transport production for significantly less congestion and emissions.
This rail potential is an upper bound that can probably not be reached, but it is interesting to see that these movements are on Melbourne-Sydney-Brisbane corridor, thus along an existing rail corridor capable of taking on this demand and with the potential of reducing congestion, accidents, and emissions along the main interstate corridor in Australia.

The full report where we detail the model assumptions and present the results for several commodities can be downloaded HERE.
We are fast approaching a point where there is not enough data to go forward with after the advances we have made in the past couple of months. Although challenging, the next steps in this model development will also be a very exciting challenge, as we explore alternative data, techniques, and partnerships to move this model forward.
Regardless of the path this development takes, it will also progress slower as we get busier with client projects, but these initial results are quite promising with respect to the depth and quality of insight that this model will allow providing our clients with.
Here at Outer Loop, we are often working on developing new models to answer specific transport-related questions, and we …

The new AequilibraE 1.0.1 release brings some major improvements to the graph compression which provide large runtime …
