Extending the Open-Source ecosystem to put AequilibraE on the web
Effective visualisation is critical for communicating the outputs of traffic forecasting models and studies, …

Photo by Andrew Gook
The transport modelling landscape has traditionally prioritised motorised transport, reflecting its predominance in urban mobility systems. However, research is constantly highlighting the importance of active travel in both congestion alleviation and public health enhancement.
As attention in the planning practice has started to shift towards a more comprehensive consideration of non-motorised modes, modelling approaches need to be revised to capture the intricate decision-making processes underlying these mobility choices.
Motorised and non-motorised travel represent fundamentally divergent mobility paradigms where traditional transport models predominantly employ quantitative strategies (minimizing travel times, reducing monetary costs, assessing routes based on congestion levels, etc). In contrast, walking and cycling introduce an additional complex, qualitative decision-making process that traditional models systematically overlook:
The Propensity to Cycle Tool (PCT), developed by the Leeds Institute for Data Analytics in 2016 and updated in 2020 , is a tool that addresses some of these considerations. Utilizing data from over 20 million commuters in England and Wales, the tool provides insights into cycling propensity for commute, with the same approach applied to school trips.
In the spirit of not reinventing the wheel, we asked ourselves how we could apply the insights intrinsic to that tool to a Brisbane context.
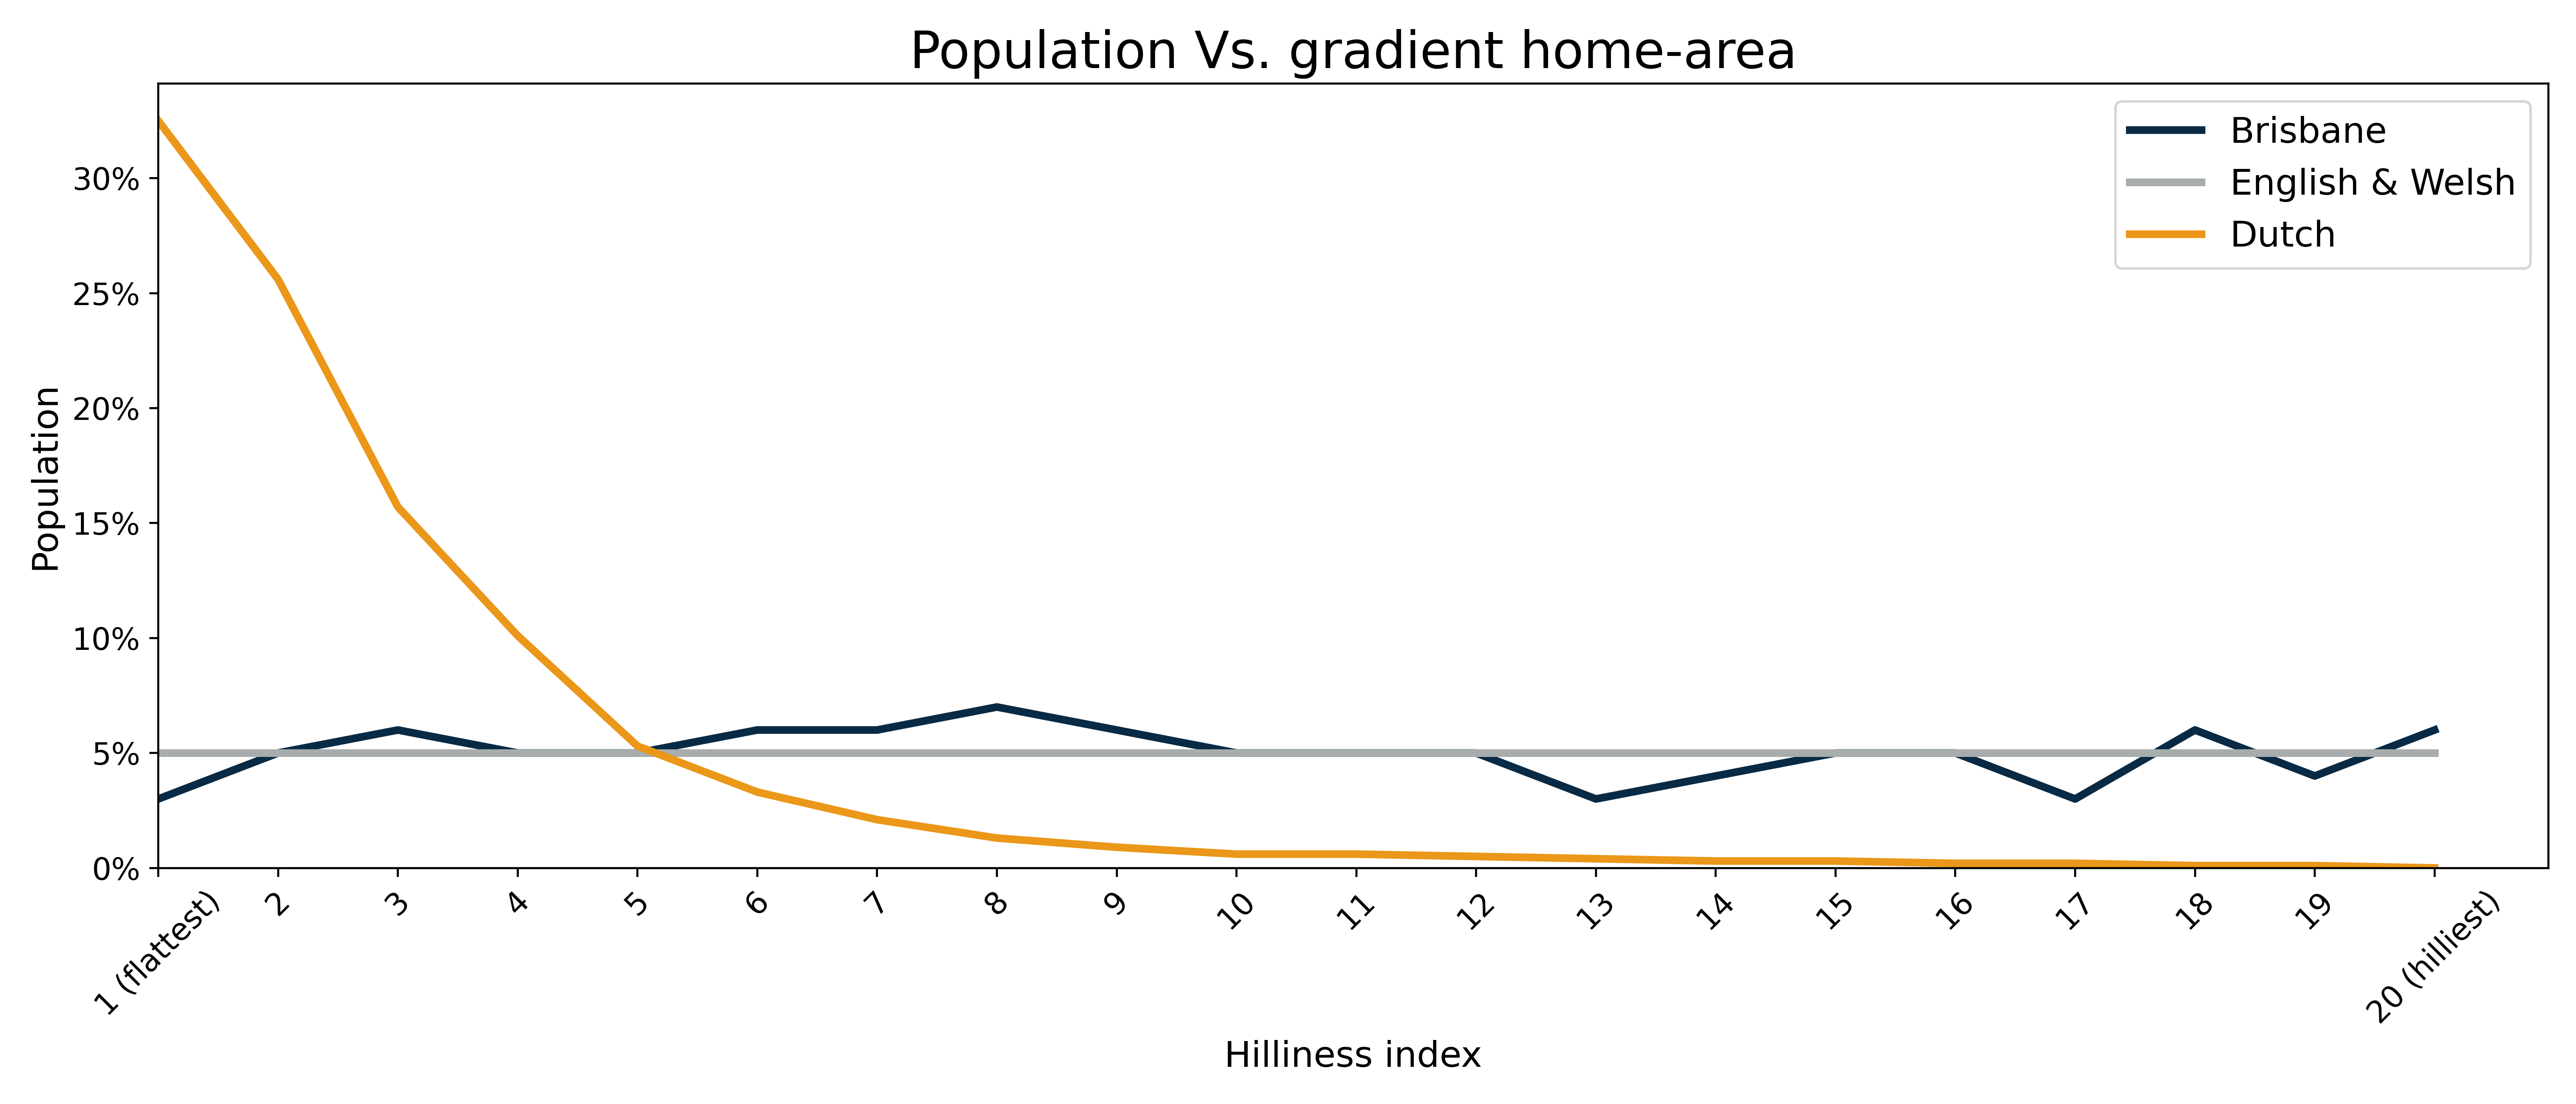
We start by taking a quick look at the 2021 Journey to Work trips, which provides the following insights:

It’s also interesting to note that we can see here clear evidence for the common assertion that “the Dutch cycle more because they don’t have any hills”
This gives us some confidence that the overall behavioural factors in Brisbane are likely similar to those observed in the English and Welsh context.
Given this, we then turned our attention to using the tool to evaluate how the use of e-bikes could increase Brisbane’s cycling mode share. This is a relevant question as the Queensland government recently announced a $2 million dollar e-bike and e-scooter rebate scheme which was so popular that it closed 33 days after opening. This scheme allowed Queenslanders to purchase e-bikes at a similar price as normal bikes.
First, we analysed topographic data of Brisbane to determine the average “hilliness” of the city and found that the average gradient across Brisbane falls somewhere between 2% and 3%. This allows us to start plugging values into the tool, allowing us to see the potential effect that e-bikes ownership could have on cycle trip making in Brisbane.

Modelling ubiquitous e-bike access reveals the following potential changes to cycling trips:
The associated anticipated mobility outcomes with this increase in propensity to cycle in Brisbane are:
The above is only a rough estimate, but highlights that the type of targeted spending that comes from an e-bike rebate scheme has the potential to significantly reduce the number of vehicles on our roads in those peak commute periods. Given that $2M is enough to build roughly 3 meters of the Clem Jones tunnel , this would appear to be a very cost-effective way to spend taxpayer funds.
The above illustrates just one aspect of the responsiveness of this tool and there is much more detailed analysis that could be undertaken with the development of better local demand and network data as well as calibration to our local context.

Effective visualisation is critical for communicating the outputs of traffic forecasting models and studies, …

Recently I’ve had the opportunity to work on a number of project that aim to put the advanced power of Python into …